2020 Integrated Report

CREATING RIPPLES OF CARE
THROUGH WATER AND SANITATION
CREATING RIPPLES OF CARE
THROUGH WATER AND SANITATION
Sustainability at Manila Water
Manila Water’s commitment to protecting the environment addresses an existential risk: if there is no raw water, there is no business. The Company is heavily dependent on the provisioning function of ecosystem services, particularly on raw water supply, which justifies its significant investments in the natural environment. The Company helps protect the environment through watershed protection, rehabilitation, wastewater treatment and realizing operational efficiencies throughout the water value chain. These are also complemented by people-centric programs such as environmental stewardship advocacies and community initiatives to address the root causes of environmental degradation: poverty and apathy.
Manila Water’s relationship with nature is not one-way though. The relationship is reciprocal, as the Company also performs services to ecosystems mainly through its wastewater operations. After water is used by customers, the Company collects and treats wastewater before discharging clean effluent back to the environment, thus reducing the pollution of rivers and lakes, and avoiding the release of greenhouse gases that otherwise untreated wastewater would form. In the course of championing UN SDG 6 (Access to Water and Sanitation), three allied sustainable development goals (SDG 13 – Climate Action, SDG 14 – Life Below Water, and SDG 15 – Life on Land) are also being supported by Manila Water.
MANAGING WATER RESOURCES
GRI:2018 303-1, 303-3, SASB IF-WU-440a.1., SASB IF-WU-440a.3.
Manila Water ensures that raw water withdrawals from groundwater and surface water sources as well as its discharges are within regulatory limits and done in a manner that protects the water resources and receiving bodies of water. Manila Water has commissioned studies to understand the viability and sustainability of aquifer resources. Both surface & ground water abstractions are regulated by the water authority through the issuance of water permits or water rights.
Water Withdrawal by Source (in mcm)
| 2018 | 2019 | 2020* | |
|---|---|---|---|
| Groundwater | 85.1 | 93.0 | 110.0 |
| Surface Water | 776.9 | 747.4 | 777.7 |
| Bulk Water or Third Party Water | 3.0 | 3.4/td> | 5.4 |
| Groundwater | 0.2 | 0.2 | 0.3 |
| Surface Water | 2.8 | 3.2 | 5.2 |
| Total | 864.9 | 843.8 | 893.1 |
*Manila Water started the new classification of GRI:2018 303-3 in 2020 to segregate bulk water or third-party water sources, classify if raw water is freshwater or other water, and if raw water comes from water-stressed areas. In 2020, all water withdrawn is freshwater and no water is withdrawn from high to extremely high baseline water stress region.

from surface water

from groundwater

from bulk water or third-party water (surface water source)

freshwater abstracted

raw water abstracted from high to extremely high baseline water stress region
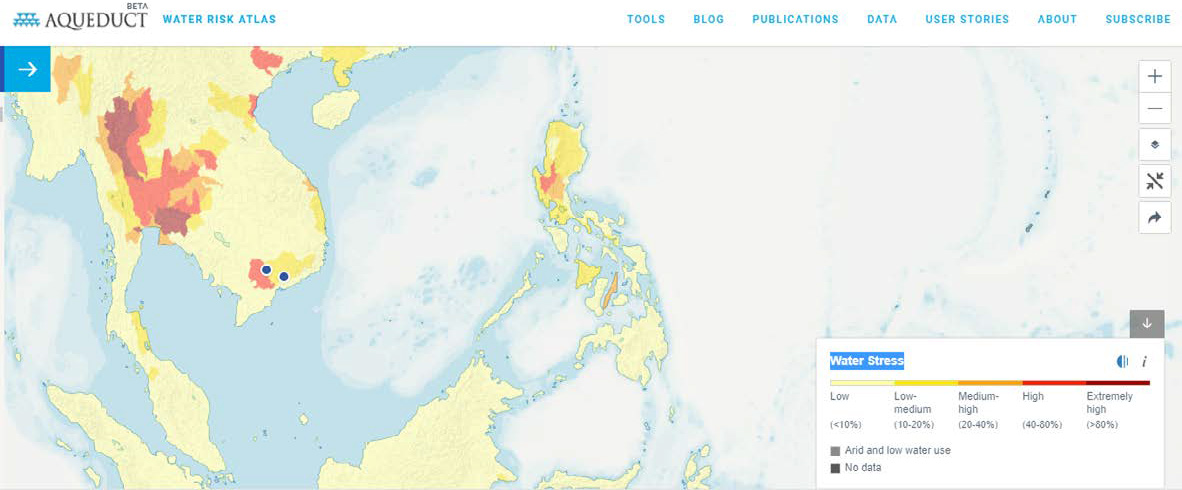
Source: World Resources Institute’s Water Risk Atlas tool, Aqueduct
WATER SOURCES OF MANILA WATER
The Company’s total water withdrawal in 2020 was 893.1 million cubic meters (MCM) of raw water across all its operating subsidiaries in the Philippines and Vietnam. 8.1 mcm of backwash water of water treatment was recovered and reused to add on the production of potable water. Based on the World Resources Institute’s Water Risk Atlas tool, Aqueduct, Manila Water does not abstract water from high to extremely high baseline water stressed regions. All raw water abstracted is freshwater, which is defined as water with total dissolved solids of less than 1000 mg/L.
As much as possible, Manila Water prefers to utilize surface water sources as these are more renewable compared to groundwater. Eighty seven percent of the Company’s raw water comes from surface water. The East Zone Concession abstracts 98 percent of its raw water from Umiray, Angat, Ipo, La Mesa Manila water system, and Laguna Lake, and only 2 percent comes from groundwater to augment its water supply requirements while new surface water sources are being developed. Cebu Water and Boracay Water sustainably sources from the Luyang River and Nabaoy River, respectively. Kenh Dong and Thu Duc Water in Vietnam sources from Dau Tieng Lake and Dong Nai River in Ho Chi MInh, respectively.
To ensure the sustainability of groundwater sources, Manila Water monitors groundwater conditions and determines how long the aquifer reserves will last. The status of groundwater abstraction is regularly reported to the National Water Regulatory Board (NWRB).
Groundwater studies were conducted to determine the sustainability of existing sources. The East Zone Concession’s groundwater study in Metro Manila East Zone from 2016 reveals that groundwater levels are sufficient until 2055 with the extraction rates approved by NWRB even with a climate change scenario included. In addition, Manila Water has an on-going study on the assessment of groundwater dynamics and water quality of groundwater sources using isotope and nuclear techniques. This study is in partnership with the Philippine Nuclear Research Institute and National Water Resources Board.
Laguna Water conducts a groundwater study every four years since 2012. The results of the studies in 2012 and 2016 show that the groundwater in the covered areas is sufficient until 2090, at current rates of utilization growth. The 2020 groundwater study of Laguna Water focused on the impact of a 7.2 magnitude West Valley Fault earthquake on surrounding aquifers, the impact of Laguna Wellfield’s 100 MLD extraction on downstream aquifers, and the effect of expanding the said wellfield.
The 2016 groundwater study of Clark Water identified locations of aquifer-rich sources and their available yields. Clark Water also commissioned surface water feasibility studies on the Sacobia, Marimla, and Bamban rivers. The results of these studies were used in Clark Water’s master planning activities, for inclusion in the service improvement plan that will be reviewed by its regulator.
Manila Water keeps track of not only the water availability but also the changes in raw water quality of both surface and groundwater. Surface water supply is highly vulnerable to the impacts of climate change particularly during heavy rainfall and typhoons on degraded land which makes surface water turbid, while groundwater is dependent on natural factors such as topographic position and the mineral composition of the underlying geology. Both types of sources are affected by pollution and other human activities.
PROTECTING AND REHABILITATING WATERSHEDS
GRI 304-3, SASB IF-WU-440a.3
Manila Water recognizes the impacts of raw water availability and quality to its operations and conversely, the Company’s impacts on the water sources. Thus, the Company anchors on nature-based solutions and environmental stewardship of key watersheds that it depends on. In 2020, Manila Water funded the protection of 9,515 hectares in Ipo, La Mesa, and Upper Marikina watersheds. The Company planted 16,241 native trees in 2020 reaching a total of 1,188,020 trees nurtured since it began its watershed management initiatives. Manila Water also helped in the formulation of the Integrated Watershed Management Plan of Ipo, La Mesa, Upper Marikina, and Luyang watersheds.
Watershed Risks and Mitigation Initiatives
Manila Water has identified the risks associated with its key watersheds and the mitigation initiatives to address these risks.
| Watershed | Risks | Mitigation initiatives |
|---|---|---|
|
General Nakar (Kaliwa, Kanan, Umiray, and 13 other minor watersheds) 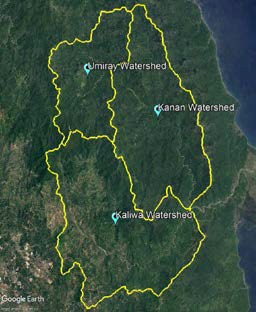
|
|
|
|
Angat 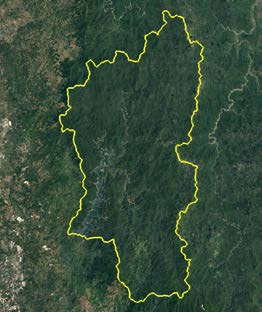
|
|
|
|
Ipo 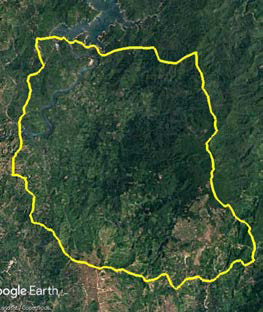
|
|
|
|
La Mesa 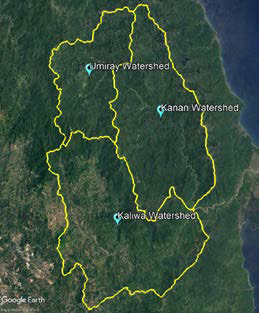
|
|
|
|
Upper Marikina 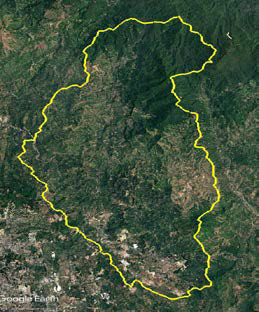
|
|
|
|
Laguna Lake 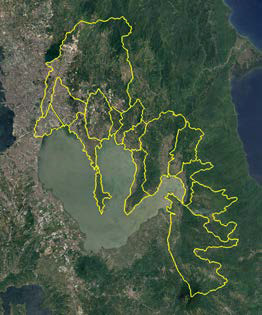
|
|
|
|
Alat 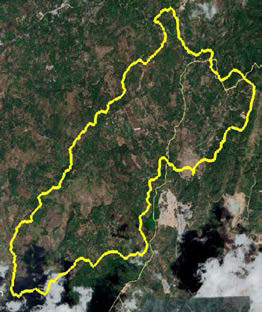
|
|
|
|
Nabaoy 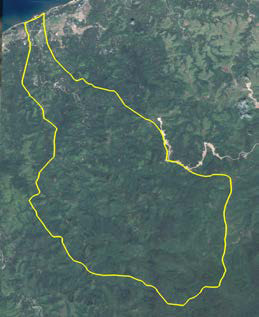
|
|
|
|
Luyang 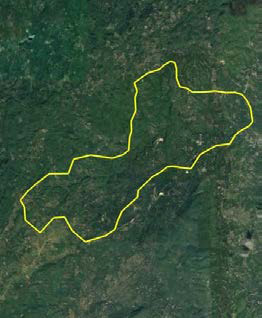
|
|
|
TREATING WASTEWATER RESPONSIBLY
SASB IF-WU-140b.1.
Through its wastewater operations, Manila Water supports the abatement of water pollution by collecting and treating the water used by customers before discharging them to receiving bodies of water. The formation of methane, which has 21 times the global warming potential of carbon dioxide, is avoided through the treatment of wastewater in a centralized aerobic wastewater treatment instead of treating it passively in household septic tanks.
The East Zone Concession has expanded its sewer coverage to 31.48 percent in 2020 and continuously desludges septic tanks in unsewered areas every 5 years.
The Company started operating its newest and one of the largest sewage treatment plant – the Ilugin STP with a total capacity of 100 million liters per day (mld) expandable to 165 mld. In 2020, the Company surpassed its desludging target at 111 percent even during the pandemic.
The East Zone Concession targets to attain 99 percent sewer coverage by 2037 as a commitment to the Supreme Court Mandamus with this wastewater masterplan.

Boracay Water, Clark Water, Estate Water, and Laguna Water operates their wastewater treatment facilities. Bulakan Water and Obando Water will begin their desludging services in their service coverage areas through a third-party service provider in 2021.
Wastewater Treatment Plants
| No. of wastewater treatment plants | Capacity, m3/day | No. of wastewater facilities located in 100-year flood zones | Capacity, m3/day of wastewater facilities located in 100-year flood zones | |
|---|---|---|---|---|
| Boracay Water | 2 | 11,500 | 0 | 0 |
| Clark Water | 1 | 30,000 | 0 | 0 |
| Estate Water | 24 | 67,740 | 0 | 0 |
| Laguna Water | 2 | 11,070 | 0 | 0 |
| East Zone Concession | 41 | 410,097 | 19 | 275,802 |
| Total | 70 | 530,407 | 19 | 275,802 |
Nineteen out of seventy wastewater treatment facilities with a total capacity of 275,802 m3/day are located in medium to high flood zones (0.5 meter to more than 1.5-meter flood level) based on a 100- year flood. Wastewater treatment facilities within these zones are built or retrofitted such that operations will not be affected, or there will be minimal impact during flooding such that normal operations can resume promptly after a short downtime.
Wastewater Treatment
| 2018 | 2019 | 2020 | |
|---|---|---|---|
| Wastewater treated, mcm | 62.4 | 62.4 | 74.1 |
| Bio-chemical oxygen demand (BOD) removed1, tons BOD | 9,102 | 13,440 | 12,613 |
| Carbon dioxide avoided due to wastewater treatment2, tons CO2e | 57,346 | 79,085 | 74,030 |
Note:
1. BOD, or biochemical oxygen demand, is a proxy indicator of the quality (or organic content) of the waste. It pertains to the organic component removed from wastewater (in the form of sludge).
2. Computation of carbon dioxide avoided was based on the updated 2019 Intergovernmental Panel on Climate Change (IPCC) Guidelines for National Greenhouse Gas Inventories

Wastewater treated

BOD removed

CO2e Avoided
Manila Water treated a total of 74.1 mcm of wastewater in its 70 centralized aerobic wastewater treatment facilities before properly discharging it, avoiding 12,613 tons of organic pollutants from entering the water body. Further, 74,030 tons CO2e was avoided from entering the atmosphere. Manila Water complies with the effluent guidelines and other regulations on wastewater. The details of the effluent quality are in the Environmental Performance Index of the 2020 IR microsite.
Manila Water has started the upgrading of its wastewater facilities to meet its DENR-approved compliance action plans in compliance with the new DENR Revised General Effluent Standards of 2016 (DAO 2016-08) which requires the removal of nutrients such as nitrogen, potassium, and ammonia from wastewater to reduce algal growth in water bodies.
ENSURING ENVIRONMENTAL COMPLIANCE
GRI:2018 306-2, GRI 307-1
To ensure environmental compliance, Manila Water has a proactive approach. Potential non-compliance is monitored frequently and acted upon to avoid adverse environmental impacts. Manila Water has Pollution Control Officers appointed for each facility who ensure compliance with all environmental regulatory requirements and whose performance is validated through regular internal audits. Waste minimization and pollution prevention are being implemented through operational control measures needed to address significant environmental aspects and impacts as identified in Hazard Identification, Risk Assessment, and Control (HIRAC) system. Manila Water had no significant environmental fines and penalties of more than PhP 50,000 nor non-monetary sanctions in 2020.
SOLID WASTE MANAGEMENT
The largest contributor to non-hazardous solid wastes is wastewater treatment which converts organic pollution into microbial biomass in sludge, a by-product of aerobic treatment which further undergoes dewatering to yield biosolids. Grits and screenings from raw wastewater are properly disposed of in sanitary landfills. Biosolids from the East Zone Concession and Boracay Water facilities are hauled, composted, and used as a soil conditioner in lahar-affected areas in Pampanga. Laguna Water composts biosolids within its treatment facility while Clark Water dries and stores biosolids in a drying pond in its wide expansive property. Other nonhazardous solid wastes generated in offices and facilities are segregated and disposed of properly. Recyclable materials are sold to junk shops while old meters are sold to recyclers.
Non-hazardous Waste Disposed, tons
| 2018 | 2019 | 2020 | |
|---|---|---|---|
| Biosolids | 44,564 | 33,736 | 21,939 |
| Grit and screenings | 2,085 | 1,060 | 1,238 |
| Total | 46,649 | 34,796 | 23,177 |
HAZARDOUS WASTE MANAGEMENT
Manila Water fully complies with the regulatory requirements set by DENR on hazardous waste management. East Zone Concession donates its used oil and used-lead acid batteries to ABS-CBN Foundation’s Bantay Langis and Bantay Baterya, respectively. The Company shifted to LED lighting, reducing the amount of busted fluorescent lamps generated yearon- year. In 2020, a total of 133.04 tons of hazardous wastes were generated. Hazardous wastes are properly stored in hazardous wastes storage and transported, treated, and safely disposed of through DENR-accredited service providers.

Hazardous Waste Generated, tons
| 2018 | 2019 | 2020 | |
|---|---|---|---|
| Busted fluorescent lamps | 7.45 | 0.56 | 0.22 |
| Contaminated materials | 0.23 | 1.76 | 0.25 |
| Other hazardous wastes | 45.00 | 0.41 | 120.22* |
| Spent Chemicals | 0.10 | 0.34 | 0 |
| Used lead-acid batteries | 2.05 | 3.24 | 3.45 |
| Waste oil | 6.56 | 13.69 | 4.86 |
| Grease traps | 6.38 | 7.72 | 4.05 |
| Waste Electrical and Electronic Equipment | 0.03 | 0 | 0 |
| Total | 67.79 | 27.72 | 133.04 |
*Increase of other hazardous wastes type was due to a one-time disposal of hazardous wastes.
IMPROVING OPERATIONAL EFFICIENCY
Beyond environmental compliance, Manila Water continuously finds ways to improve its operations across its value chain to reduce resource consumption, environmental impacts, and operating expenses.
Non-revenue Water
In 2020, Manila Water incurred 107.5 mcm non-revenue water (NRW) losses due to pipe leaks, illegal connection, pilferage, and use of fire hydrants. Manila Water undertakes a continuing NRW reduction program to attain or maintain the optimal NRW reducing wastage of water, energy, chemical, and other raw materials. The program involves both technological and stakeholder-approach. Manila Water utilizes the district metering areas organization approach in managing nonrevenue water that usually arises from too much local pressure, undetected leaks and metering error. Furthermore, the Company works with the community kasanggas in identifying leaks and illegal connections.
In 2020, managing NRW was a big challenge due to the inability of field personnel to ‘walk the line’ during the community quarantines, thus preventing a timely detection and resolution of leaks, real time adjustment of pressure and identification of tampered meters.
End-of period Non-revenue water, percent
| % NRW at the start of operation | 2018 | 2019 | 2020 | |
|---|---|---|---|---|
| Boracay Water | 29% (2010) | 13.8% | 9.8% | 21.7%1 |
| Bulacan Aqua | 50% (2017) | 34.3% | 24.0% | 23.7% |
| Bulakan Water | 39.3% (2019) | - | 39.3% | 37.5% |
| Calasiao Water | 12.1% (2018) | 5.5% | 6.8% | 6.1% |
| Cebu Water | 5% (2015) | 2% | 3% | 3.6% |
| Clark Water | 15% (2011) | 6.7% | 7.4% | 6.0% |
| Estate Water | 47% (2016) | 38.0% | 30.0% | 15.0% |
| Laguna Water | 48% (2009) | 16.7% | 18.0% | 17.9% |
| East Zone Concession | 63% (1997) | 11.4% | 10.4% | 15.5%2 |
| Obando Water | 52.9% (2018) | 47.7% | 49.8% | 49.2% |
| Kenh Dong Water | - | 3.0% | 3.0% | 3.0% |
| Thu Duc Water | - | 1.8% | 0.0% | 1.5% |
Notes:
1 Boracay Water increase in NRW is driven by the 31 pipe leaks including the 100mm and 200mm distribution line & 300mm transmission line in Balabag area damaged by DPWH contractor due to the ongoing road and drainage rehabilitation in the island.
2 There was an increase in NRW in the East Zone Concession due to maintenance of high pressure to customers to ensure high water availability during the pandemic as mandated by the government and less implementation of network maintenance activities such as leak detection, leak repair, customer meter replacement due to the limitations during quarantine.
CHEMICALS
GRI 301-1
The treatment of raw water for driking uses non-renewable chemicals such as alum, blended phosphate, chlorine, lime, polyaluminum chloride (PAC), polymer, and sodium hydroxide to make water potable. Aside from the biological aerobic process, wastewater treatment utilizes non-renewable chemicals such as chlorine, PAC, and polymer.
Chemical consumption is dependent on the quality of raw water and incoming wastewater. In 2020, the Company had a significant decrease in the chemical concentration of its water supply, due to lower turbidity in surface water compared to 2019. Incoming raw water and wastewater quality are regularly monitored to adjust the concentration of chemicals for optimum treatment. Innovations and various operational improvements are constantly taking place to optimize processes. Watershed protection and rehabilitation, the Company’s medium to long-term nature-based solution to address raw water quality, are further strengthened to prevent soil erosion and raw water turbidity during heavy rainfall.
Chemical Consumption, tons
| 2018 | 2019 | 2020 | |
|---|---|---|---|
| Water Supply | 23,656.4 | 97,072.6 | 26,595.9 |
| Wastewater | 2,517.0 | 2,485.4 | 2,659.2 |
| Total | 26,173.4 | 99,558.0 | 29,255.1 |
Chemical Consumption Intensity
| 2018 | 2019 | 2020 | |
|---|---|---|---|
| Water Supply, tons/MCM raw water abstracted | 28.50 | 115.1 | 29.5 |
| Wastewater, tons/MCM treated | 40.38 | 39.02 | 35.9 |
ENERGY AND EMISSIONS
GRI 302-1, 302-3, 302-4, 305-1, 305-2, 305-3, SASB IF-WU-130a.1.
Energy is one of the highest operating expenses of Manila Water given the energyintensive nature of its operations. Manila Water continuously innovates to further improve energy efficiency and explores the use of renewable energy in its operations.
The East Zone Concession had secured ISO 50001 Energy Management System certification on its ten largest-energy consuming facilities from 2014 to 2019. Since the Philippine Congress passed the Energy Efficiency and Conservation Act (RA 11285) in 2019, the Company retained and expanded the Energy Management System on all facilities without securing re-certification. The new law requires, among others, (1) the integration of an Energy Management System Policy into business operations based on the ISO 50001 framework or other frameworks, (2) the submission of an Annual Energy Utilization Report, and Annual Energy Efficiency and Conservation Report, (3) setting up of energy efficiency, conservation and renewable energy programs, (4) improvement of average Specific Energy Consumption and (5) the appointment of a Certified Energy Conservation Officer or Certified Energy Manager. Manila Water has taken steps to comply with all the requirements of RA 11285 and is set to submit its report to the Department of Energy in April 2021.

ENERGY EFFICIENCY INITIATIVES
East Zone Concession has installed solar panels at FTI Septage Treatment Plant, Makati North Sewage Treatment Plant, and Delos Santos Pumping Station. On average, these facilities generate 170,000 kWh solar power every year. In addition, Manila Water will start sourcing renewable energy equivalent to 16 percent of the East Zone Concession’s electricity consumption through a renewable power purchase agreement with the Open Access service-provider starting on mid-2021. Clark Water and Boracay Water use solar streetlights, while Laguna Water has installed solar panels in their Booster 3 facility that generates an average of 90,000 kwh/year. Estate Water will also utilize solar energy in its facilities starting 2021.

Water Supply Operations

Wastewater Operations

General
Electricity Consumption, million kWh
| 2018 | 2019 | 2020 | |
|---|---|---|---|
| Electricity | 231.0 | 244.2 | 265.6 |

percentage grid electricity1
Fuel Consumption, thousand liters
| 2018 | 2019 | 2020 | |
|---|---|---|---|
| Diesel | 1,226* | 1,598* | 1,471 |
| Gasoline | 166 | 190 | 128 |
| Total | 1,392 | 1,788 | 1,599 |
*2018 and 2019 diesel consumption due to inclusion of the desludging consumption of Boracay Water and Clark Water to within the organization consumption since desludging is done internally in these two business units.

percentage Open Access2
Energy Consumption, GigaJoules (GJ)
| 2018 | 2019 | 2020 | |
|---|---|---|---|
| Electricity | 831,439 | 879,884 | 956,071 |
| Diesel | 47,999 | 61,975 | 56,955 |
| Gasoline | 5,775 | 6,193 | 4,463 |
| Total | 884,214* | 948,052* | 1,017,489 |
*Restated 2018 and 2019 energy consumption due to inclusion of the desludging consumption of Boracay Water and Clark Water to within the organization consumption since desludging is done internally in these two business units

Percentage renewable energy3
Energy Intensity
| 2018 | 2019 | 2020 | |
|---|---|---|---|
| Water Supply, GJ/MCM billed volume | 1,017 | 1,072 | 1,150 |
| Wastewater, GJ/MCM wastewater treated | 1,487* | 1,668* | 1,351 |
*Restated the 2018 and 2019 wastewater energy intensity due to inclusion of the desludging consumption of Boracay Water and Clark Water to within the organization consumption since desludging is done internally in these two business units.

Percentage Fuel
1 Percent grid electricity – grid, excluding open access
2 Open Access – direct purchase of electricity from the power supplier
3 Renewable energy includes on-site renewable energy generated; purchased through a renewable power purchase agreement but excludes the renewable portion of the electricity grid that is outside the influence of the Company (as per SASB definition)
Manila Water supports the Philippines’ climate change mitigation targets under the Paris Agreement and the UN SDGs on Climate Action through its energy efficiency and renewable energy initiatives, and the expansion of wastewater coverage to avoid methane generation from septic tanks. The Company also helps in carbon sequestration through watershed/forest protection and rehabilitation.
Greenhouse Gas Emissions, tons CO2e
| 2018 | 2019 | 2020 | |
|---|---|---|---|
| Scope 1 a | 3,680 | 4,711* | 4,198 |
| Scope 2 b | 164,015 | 172,268 | 180,872 |
| Scope 3 c | 1,563* | 1,599* | 1,117 |
| TOTAL | 169,258 | 178,577 | 187,677 |
a Scope 1 emissions are direct CO2 emissions from the use of fuel for vehicles, generator sets, and other equipment. Updated gasoline emission factor from 2.34 kg CO2e/L to 2.27 kg CO2e/L, the latest emission factor of GHG Protocol.
b Scope 2 emissions are indirect CO2 emissions from the use of electricity of the Company. Scope 2 emission factor for Open Access (0.69 kg CO2e/kWh), Luzon and Visayas Grid (0.64 kg CO2e/kWh ) were computed by multiplying the monthly grid blend with the specific emission factor per fuel type. The emission factor of Mindanao grid (0.7797 kg CO2e/ kWh) and Vietnam Grid (0.8795 kg CO2e/kWh) were based on the latest available National Grid Emission Factor.
c Scope 3 emissions are CO2 emissions from the desludging operations by contractors.
*Restated due to inclusion of desludging diesel consumption of Boracay Water and Clark Water in the diesel consumption
within the organization.

CO2e avoided due to wastewater treatment
GHG Intensity
| 2018 | 2019 | 2020 | |
|---|---|---|---|
| Water Supply operations, tons CO2e/MCM billed volume | 195 | 203 | 212 |
| Wastewater operations, tons CO2e/MCM wastewater treated | 276 | 308 | 237 |

CO2e carbon sequestered1 through its tree nurturing initiatives in 2,288 hectares
1 Based on rough estimates using carbon sequestration of 236 tons of CO2 per hectare in a natural forest and 88 tons of CO2 per hectare in an agroforestry from a published literature of Camacho, et.al, Carbon Sequestration Benefits of the Makiling Forest Reserve, Philippines. 2009.
ADVOCATING ENVIRONMENTAL PROTECTION
Manila Water educates and engages its employees, customers, supply chain, and key stakeholders to advance its environmental protection initiatives. The Company believes that through partnerships and collaboration, more can be collectively done. Manila Water regularly conducts engagement activities through channels including seminars, trainings, forums, bulletins, and social media. Lakbayan Water Trail Tour, a long-time water education program and environmental advocacy of Manila Water to help raise awareness on the value of water and wise and mindful consumption of water, catered to 54 groups and 1,791 participants in 2020. During the pandemic, Lakbayan shifted to online sessions with topics on water and wastewater treatment processes. Participants were also encouraged in doing their Toka (share) for the environment by doing any of the four applicable call to actions 1) solid waste segregation, 2) sewer line connection, 3) solid waste management, 4) sharing the advocacy to friends and family.
The Company further strengthened its environmental awareness campaign in its social media platforms to continuously educate stakeholders.


Manila Water strongly promotes environmental sustainability through various media including its social media platforms.