Coverage: January 1- December 31, 2021
Raw Water Abstraction, million cubic meters
GRI:303-3
|
Water Abstraction by type of water source in mcm
|
|
Business Unit
|
2019
|
2020
|
2021
|
|
Bulk-Ground water
|
0.19
|
0.27
|
0.34
|
|
Estate Water
|
0.19
|
0.27
|
0.34
|
|
Bulk-Surface water
|
4.44
|
5.08
|
4.68
|
|
East Zone
|
1.41
|
-
|
-
|
|
Bulakan Water
|
-
|
1.83
|
1.34
|
|
Estate Water
|
0.00
|
0.00
|
0.03
|
|
Obando Water
|
3.03
|
3.25
|
3.31
|
|
Groundwater
|
92.98
|
109.96
|
112.24
|
|
East Zone
|
12.53
|
11.96
|
6.31
|
|
Bulacan Aqua
|
2.47
|
2.76
|
2.80
|
|
Bulakan Water
|
-
|
2.69
|
2.77
|
|
Calasiao Water
|
0.40
|
0.55
|
0.61
|
|
Cebu Water
|
-
|
1.27
|
0.81
|
|
Clark Water
|
15.58
|
14.67
|
13.59
|
|
Estate Water
|
8.22
|
16.12
|
16.40
|
|
Laguna Water
|
53.35
|
59.62
|
58.15
|
|
Obando Water
|
0.42
|
0.32
|
0.18
|
|
South Luzon Water
|
-
|
-
|
7.89
|
|
Tagum Water
|
-
|
-
|
2.73
|
|
Surface water
|
746.03
|
786.71
|
788.57
|
|
Kenh Dong Water
|
64.29
|
65.58
|
69.92
|
|
Thu Duc Water
|
113.18
|
110.98
|
112.24
|
|
East Zone
|
549.35
|
584.19
|
580.16
|
|
Boracay Water
|
5.22
|
4.02
|
2.94
|
|
Calbayog Water
|
-
|
4.60
|
4.92
|
|
Cebu Water
|
13.98
|
11.19
|
10.62
|
|
Laguna Water
|
-
|
1.72
|
2.31
|
|
Tagum Water
|
-
|
4.44
|
5.46
|
|
Total
|
843.64
|
902.03
|
905.83
|
1 Manila Water started the new classification of GRI:2018 303-3 in
2020 to segregate bulk water or third-party water sources, classify if raw
water is freshwater or other water, and if raw water comes from water-stressed
areas. In 2021, all water withdrawn is freshwater and no water is withdrawn
from high to extremely high baseline water stress region based on the World
Resources Institute’s Water Risk Atlas tool, Aqueduct
Surface Water Sources
|
Boracay Water
|
Nabaoy River, Malay, Aklan
|
|
Calbayog Water
|
Pan-as Hajiban
|
|
Cebu Water
|
Luyang River, Cebu
|
|
Kenh Dong Water
|
Dau Tieng Lake
|
|
Laguna Water
|
Matang Tubig Spring
|
|
East Zone
|
Umiray-Angat-Ipo-La Mesa Water Resource; Laguna Lake
|
|
Thu Duc Water
|
Dong Nai River
|
|
Tagum Water
|
Hijo River
|
|
Bulakan Water *
|
Umiray-Angat
|
|
Estate Water *
|
Umiray-Angat- Ipo
|
|
Obando Water *
|
Umiray- Angat
|
* Bulk Water Supply from Surface Water
2021 Watershed Protected in hectares
GRI 304-3
|
|
Hectares
|
|
|
Ipo Watershed
|
6,600
|
Through Bantay Gubat
|
|
La Mesa Watershed
|
2,659
|
Through ABS-CBN Foundation’sBantay Kalikasan
|
|
General Nakar Waterhed
|
162,613
|
Through SIAD Project of Gen. Nakar; Includes protection of Kaliwan,
Kanan, Umiray and minor watersheds
|
|
Total
|
171,872
|
|
Total Trees Planted
GRI 304-3
|
|
Years Covered
|
Hectares Reforested
|
Total Number of Trees Planted
|
|
Ipo Watershed
|
2006-2021
|
728
|
319,868
|
|
La Mesa Watershed
|
2008-2021
|
877
|
352,429
|
|
Upper Marikina Watershed
|
2010-2021
|
757
|
473,063
|
|
General Nakar Watershed
|
2018-2021
|
53
|
33,100
|
|
Nabaoy Watershed
|
2013-2021
|
26
|
66,217
|
|
Clark Water
|
2014-2021
|
8
|
6,410
|
|
Laguna Water
|
2014-2021
|
8
|
3,900
|
|
Pan As Hayiban
|
2021
|
1
|
625
|
|
Total
|
|
2,459
|
1,255,612
|
Wastewater Treated, million cubic meters
GRI 306-1
| |
2019
|
2020
|
2021
|
|
East Zone
|
44.93
|
56.16
|
52.28
|
|
Boracay Water
|
2.00
|
1.19
|
1.23
|
|
Clark Water
|
7.03
|
6.99
|
6.85
|
|
Estate Water
|
8.15
|
7.85
|
7.45
|
|
Laguna Water
|
2.19
|
1.92
|
2.02
|
|
Total
|
64.29
|
74.11
|
69.82
|
Organic Pollution Load Removed, tons Biochemical Oxygen Demand
(BOD)
| |
2019
|
2020
|
2021
|
|
East Zone
|
6,365.20
|
7,549.70
|
5,502.57
|
|
Boracay Water
|
544.85
|
259.48
|
111.92
|
|
Clark Water
|
888.30
|
771.19
|
758.07
|
|
Estate Water
|
5,445.65
|
3,829.41
|
1,959.27
|
|
Laguna Water
|
281.14
|
203.33
|
463.23
|
|
Total
|
13,525.14
|
12,613.11
|
8,795.06
|
Carbon Dioxide Avoided due to Wastewater Treatment and BOD removal, tons
CO2 (eq)
| |
2019
|
2020
|
2021
|
|
East Zone
|
37,598.90
|
44,557.39
|
32,470.56
|
|
Boracay Water
|
3,203.50
|
1,527.17
|
652.33
|
|
Clark Water
|
5,057.78
|
4,463.23
|
4,429.38
|
|
Estate Water
|
32,109.32
|
22,570.56
|
11,554.34
|
|
Laguna Water
|
1,616.57
|
1,166.66
|
2,707.77
|
|
Total
|
79,586.08
|
74,285.03
|
51,814.37
|
2021 Effluent Quality
GRI 306-1
Boracay Water
|
WW Facility
|
Balabag STP and Manoc Manoc STP
|
|
Receiving water body
|
Sibuyan Sea
|
|
Parameters
|
DAO 35 Class SB effluent requirements
|
Effluent Quality
|
|
Minimum
|
**Average
|
Maximum
|
|
BOD5, mg/l
|
≤ 30
|
4
|
6
|
7
|
|
COD, mg/l
|
≤ 60
|
13
|
18
|
32
|
|
TSS, mg/l
|
≤ 50
|
4
|
7
|
16
|
|
Oil and Grease, mg/l
|
≤ 5
|
<1.0
|
<1.0
|
<1.0
|
|
Total Coliform, MPN/100ml
|
≤ 3,000
|
18
|
94
|
624
|
|
pH
|
6.0 – 9.0
|
7.1
|
7.2
|
7.3
|
|
Color, PCU
|
≤ 100
|
15
|
22
|
32
|
**Average is weighted average based on volume of wastewater treated of the two
STPs.
Clark Water
|
WW Facility
|
Clark Water STP
|
|
Receiving water body
|
Dolores Creek
|
|
Parameters
|
DAO 35 Class C effluent requirements
|
Effluent Quality
|
|
Minimum
|
Average
|
Maximum
|
|
BOD5, mg/l
|
≤ 50
|
1
|
6.02
|
24
|
|
COD, mg/l
|
≤ 100
|
21
|
60.1
|
96
|
|
TSS, mg/l
|
≤ 70
|
2
|
13.8
|
43
|
|
Oil and Grease, mg/l
|
≤ 5
|
0.94
|
3.75
|
4.7
|
|
Total Coliform, MPN/100ml
|
≤ 10,000
|
0
|
58
|
2,400
|
|
pH
|
6.5 – 9.0
|
6.5
|
7.5
|
8.5
|
|
Color, PCU
|
≤ 150
|
5
|
16.06
|
32
|
Laguna Water
|
WW Facility
|
LTI STP
|
|
Receiving water body
|
Sta. Rosa River
|
|
Parameters
|
DAO 35 Class C effluent requirements
|
Effluent Quality
|
|
Minimum
|
Average
|
Maximum
|
|
BOD5, mg/l
|
≤ 50
|
5
|
15
|
27
|
|
COD, mg/l
|
≤ 100
|
12
|
55
|
90
|
|
TSS, mg/l
|
≤ 70
|
1
|
11
|
26
|
|
Oil and Grease, mg/l
|
≤ 5
|
<1
|
1.85
|
3.5
|
|
Total Coliform, MPN/100ml
|
≤ 10,000
|
<1.8
|
237
|
1,700
|
|
pH
|
6.5 – 9.0
|
7.1
|
7.7
|
8.3
|
|
Color, PCU
|
≤ 150
|
5
|
15
|
20
|
East Zone
|
WW Facilities
|
41 WW facilities
|
|
Receiving water body
|
Pasig River, San Juan River, Marikina River
|
|
Parameters
|
DAO 35 Class C effluent requirements
|
Effluent Quality
|
|
Minimum
|
Average
|
Maximum
|
|
BOD5, mg/l
|
≤ 50
|
|
|
|
|
COD, mg/l
|
≤ 100
|
|
|
|
|
TSS, mg/l
|
≤ 70
|
|
|
|
|
Oil and Grease, mg/l
|
≤ 5
|
|
|
|
|
Total Coliform, MPN/100ml
|
≤ 10,000
|
|
|
|
|
pH
|
6.5 – 9.0
|
|
|
|
|
Color, PCU
|
≤ 150
|
|
|
|
**Average is a weighted average based on the volume of wastewater treated of
the 41 wastewater facilities.
Water Supply Chemical Consumption, tons
301-1
|
Chemical Consumption: Water Supply in tons
|
|
Business Unit
|
2019
|
2020
|
2021
|
|
Kenh Dong Water
|
1,736.21
|
1,584.56
|
1,930.71
|
|
Thu Duc Water
|
2,639.88
|
2,489.87
|
2,701.58
|
|
East Zone
|
91,634.87
|
21,689.77
|
12,596.78
|
|
Boracay Water
|
4.94
|
3.66
|
2.86
|
|
Bulacan Aqua
|
5.12
|
14.03
|
13.08
|
|
Bulakan Water
|
-
|
0.87
|
0.48
|
|
Calasiao Water
|
9.29
|
11.64
|
11.56
|
|
Calbayog Water
|
-
|
56.21
|
59.03
|
|
Cebu Water
|
68.62
|
56.13
|
103.49
|
|
Clark Water
|
15.37
|
14.15
|
14.51
|
|
Estate Water
|
262.61
|
209.48
|
234.24
|
|
Laguna Water
|
694.14
|
520.55
|
461.47
|
|
Obando Water
|
0.50
|
1.14
|
0.53
|
|
South Luzon Water
|
-
|
3.20
|
3.73
|
|
Tagum Water
|
-
|
80.30
|
211.61
|
|
Total
|
97,071.53
|
26,735.57
|
18,345.64
|
Water Supply Chemical Consumption Intensity, tons/MCM water
abstracted
|
Business Unit
|
2019
|
2020
|
2021
|
|
Kenh Dong Water
|
27.01
|
24.16
|
27.61
|
|
Thu Duc Water
|
23.32
|
22.44
|
24.07
|
|
East Zone
|
162.68
|
36.38
|
21.48
|
|
Boracay Water
|
0.95
|
0.91
|
0.97
|
|
Bulacan Aqua
|
2.07
|
5.09
|
4.67
|
|
Bulakan Water
|
n/a
|
0.19
|
0.12
|
|
Calasiao Water
|
23.22
|
21.30
|
18.92
|
|
Calbayog Water
|
n/a
|
12.21
|
12.01
|
|
Cebu Water
|
4.91
|
4.51
|
9.05
|
|
Clark Water
|
0.99
|
0.96
|
1.07
|
|
Estate Water
|
31.19
|
12.77
|
13.97
|
|
Laguna Water
|
13.01
|
8.49
|
7.63
|
|
Obando Water
|
0.14
|
0.32
|
0.15
|
|
South Luzon Water
|
n/a
|
n/a
|
0.47
|
|
Tagum Water
|
n/a
|
18.09
|
25.86
|
|
Total
|
115.06
|
29.64
|
20.25
|
Wastewater Chemical Consumption, tons
GRI 301-1
|
Business Unit
|
2019
|
2020
|
2021
|
|
East Zone
|
1,883.53
|
2,163.57
|
4,977.24
|
|
Boracay Water
|
76.24
|
18.74
|
28.36
|
|
Clark Water
|
105.59
|
243.69
|
312.75
|
|
Estate Water
|
257.31
|
176.92
|
261.29
|
|
Laguna Water
|
56.63
|
56.29
|
90.01
|
|
Total
|
2,379.30
|
2,659.20
|
5,669.64
|
Wastewater Chemical Consumption Intensity, tons/MCM wastewater
treated
|
Business Unit
|
2019
|
2020
|
2021
|
|
East Zone
|
41.93
|
38.53
|
95.21
|
|
Boracay Water
|
38.12
|
15.79
|
23.13
|
|
Clark Water
|
15.02
|
34.86
|
45.68
|
|
Estate Water
|
31.58
|
22.52
|
35.08
|
|
Laguna Water
|
25.92
|
29.27
|
44.66
|
|
Total
|
37.01
|
35.88
|
81.21
|
End-of period Non-revenue water, percent
|
|
% NRW at the start of operation
|
2019
|
2020
|
2021
|
|
East Zone
|
63% (1997)
|
10.4%
|
15.5%
|
12.8%
|
|
Boracay Water
|
29% (2010)
|
9.8%
|
21.7%1
|
18.5%
|
|
Bulacan Aqua
|
50% (2017)
|
24.0%
|
23.7%
|
18.5%
|
|
Bulakan Water
|
39.3% (2019)
|
39.3%
|
37.5%
|
32.3%
|
|
Calasiao Water
|
12.1% (2018)
|
6.8%
|
6.1%
|
9.5%
|
|
Calbayog Water
|
37.0% (2020)
|
|
|
32.7%
|
|
Cebu Water
|
5% (2015)
|
3%
|
3.6%
|
6.8%
|
|
Clark Water
|
15% (2011)
|
7.4%
|
6.0%
|
4.9%
|
|
Estate Water
|
47% (2016)
|
30.0%
|
15.0%
|
8.8%
|
|
Laguna Water
|
48% (2009)
|
18.0%
|
17.9%
|
16.8%
|
|
Obando Water
|
52.9% (2018)
|
49.8%
|
49.2%
|
39.4%
|
|
South Luzon Water
|
39.0% (2020)
|
|
|
31.3%
|
|
Tagum Water
|
-
|
|
|
0.2%
|
|
Kenh Dong Water
|
-
|
3.0%
|
3.0%
|
3.0%
|
|
Thu Duc Water
|
-
|
0.0%
|
1.5%
|
0.5%
|
Electricity consumption, million kWh
GRI 302-1
|
Business Unit
|
2019
|
2020
|
2021
|
|
MWAP
|
47.16
|
46.81
|
47.82
|
|
Kenh Dong Water
|
9.78
|
9.95
|
9.99
|
|
Thu Duc Water
|
37.38
|
36.87
|
37.83
|
|
MWO
|
135.84
|
151.89
|
146.72
|
|
East Zone
|
135.84
|
151.89
|
146.72
|
|
MWPV
|
61.38
|
76.40
|
77.39
|
|
Boracay Water
|
3.86
|
2.58
|
2.24
|
|
Bulacan Aqua
|
1.18
|
1.26
|
1.44
|
|
Bulakan Water
|
-
|
1.40
|
1.35
|
|
Calasiao Water
|
0.14
|
0.19
|
0.20
|
|
Calbayog Water
|
-
|
1.66
|
1.38
|
|
Cebu Water
|
5.09
|
5.21
|
7.05
|
|
Clark Water
|
14.09
|
14.92
|
13.15
|
|
Estate Water
|
13.16
|
15.94
|
14.41
|
|
Laguna Water
|
23.57
|
25.24
|
26.57
|
|
Obando Water
|
0.28
|
0.28
|
0.17
|
|
South Luzon Water
|
-
|
5.89
|
5.81
|
|
Tagum Water
|
-
|
1.83
|
3.62
|
|
MWTS
|
0.49
|
0.21
|
-
|
|
Healthy Family
|
0.49
|
0.21
|
-
|
|
Total
|
244.87
|
275.32
|
271.93
|
Electricity consumption, million kWh
| |
2019
|
2020
|
2021
|
|
Non-Renewable Energy
|
244.58
|
273.83
|
258.14
|
|
Renewable Energy
|
0.29
|
1.49
|
13.79
|
|
Total
|
244.87
|
275.32
|
271.93
|
Note: Renewable Energy includes both Onsite solar energy generation and
purchased renewable energy in the Open Access
Gasoline consumption, liters
GRI 302-1
|
Business Unit
|
2019
|
2020
|
2021
|
|
MWAP
|
-
|
14,427
|
12,692
|
|
Kenh Dong Water
|
-
|
1,020
|
1,020
|
|
Thu Duc Water
|
-
|
13,407
|
11,672
|
|
MWO
|
57,374
|
44,093
|
54,921
|
|
East Zone
|
57,374
|
44,093
|
54,921
|
|
MWPV
|
67,397
|
65,068
|
73,099
|
|
Boracay Water
|
5,458
|
4,638
|
6,035
|
|
Bulacan Aqua
|
1,852
|
682
|
1,900
|
|
Bulakan Water
|
1,653
|
4,905
|
6,491
|
|
Calasiao Water
|
2,413
|
1,090
|
1,349
|
|
Calbayog Water
|
-
|
3,370
|
3,791
|
|
Cebu Water
|
970
|
1,113
|
510
|
|
Clark Water
|
5,430
|
2,735
|
3,422
|
|
Estate Water
|
6,576
|
18,458
|
7,195
|
|
Laguna Water
|
42,663
|
27,719
|
28,217
|
|
Obando Water
|
383
|
359
|
1,195
|
|
South Luzon Water
|
-
|
-
|
12,932
|
|
Tagum Water
|
-
|
-
|
62
|
|
MWTS
|
54,829
|
8,234
|
-
|
|
Healthy Family
|
54,829
|
8,234
|
-
|
|
Total
|
179,600
|
131,822
|
140,712
|
Diesel consumption, liters
GRI 302-1
|
Business Unit
|
2019
|
2020
|
2021
|
|
MWAP
|
90
|
7,735
|
5,542
|
|
Kenh Dong Water
|
-
|
960
|
960
|
|
Thu Duc Water
|
90
|
6,775
|
4,582
|
|
MWO
|
431,109
|
728,154
|
670,187
|
|
East Zone
|
431,109
|
728,154
|
670,187
|
|
MWPV
|
701,449
|
777,520
|
1,015,660
|
|
Boracay Water
|
137,799
|
104,955
|
46,490
|
|
Bulacan Aqua
|
-
|
4,539
|
4,062
|
|
Bulakan Water
|
58
|
1,494
|
10,091
|
|
Calasiao Water
|
4,860
|
43,174
|
11,106
|
|
Calbayog Water
|
-
|
38,507
|
82,030
|
|
Cebu Water
|
17,151
|
9,524
|
68,232
|
|
Clark Water
|
149,876
|
66,867
|
64,446
|
|
Estate Water
|
336,007
|
428,067
|
581,420
|
|
Laguna Water
|
55,006
|
63,232
|
58,413
|
|
Obando Water
|
692
|
1,596
|
1,061
|
|
South Luzon Water
|
-
|
-
|
43,637
|
|
Tagum Water
|
-
|
15,565
|
44,672
|
|
MWTS
|
46,286
|
12,366
|
-
|
|
HealthyFamily
|
46,286
|
12,366
|
-
|
|
Total
|
1,178,934
|
1,525,775
|
1,691,389
|
Diesel Consumption, Desludging of Service Providers (Liters)
|
Business Unit
|
2019
|
2020
|
2021
|
|
MWO
|
566,504.80
|
374,416.30
|
551,428.00
|
|
East Zone
|
566,504.80
|
374,416.30
|
551,428.00
|
|
MWPV
|
13,222.01
|
13,592.83
|
16,471.22
|
|
Boracay Water
|
-
|
-
|
-
|
|
Clark Water
|
-
|
-
|
-
|
|
Estate Water
|
-
|
-
|
-
|
|
Laguna Water
|
13,222.01
|
13,592.83
|
16,471.22
|
|
Total
|
579,726.80
|
388,009.20
|
567,899.20
|
Energy consumption, GigaJoules (GJ)
|
Business Unit
|
2019
|
2020
|
2021
|
|
MWAP
|
169,788
|
169,334
|
172,801
|
|
Kenh Dong Water
|
35,221
|
35,876
|
36,026
|
|
Thu Duc Water
|
134,567
|
133,458
|
136,775
|
|
MWO
|
507,691
|
576,516
|
556,049
|
|
East Zone
|
507,691
|
576,516
|
556,049
|
|
MWPV
|
250,457
|
307,408
|
320,442
|
|
Boracay Water
|
19,432
|
13,516
|
10,059
|
|
Bulacan Aqua
|
4,303
|
4,736
|
5,410
|
|
Bulakan Water
|
60
|
5,276
|
5,466
|
|
Calasiao Water
|
778
|
2,376
|
1,202
|
|
Calbayog Water
|
-
|
7,592
|
8,275
|
|
Cebu Water
|
19,021
|
19,176
|
28,054
|
|
Clark Water
|
56,715
|
56,386
|
49,959
|
|
Estate Water
|
60,621
|
74,580
|
74,631
|
|
Laguna Water
|
88,476
|
94,294
|
98,907
|
|
Obando Water
|
1,050
|
1,078
|
677
|
|
South Luzon Water
|
-
|
21,211
|
23,044
|
|
Tagum Water
|
-
|
7,187
|
14,758
|
|
MWTS
|
5,456
|
1,535
|
-
|
|
Healthy Family
|
5,456
|
1,535
|
-
|
|
Total
|
933,392
|
1,054,794
|
1,049,292
|
|
Business Unit
|
2019
|
2020
|
2021
|
|
MWAP
|
169,787.74
|
169,334.36
|
172,801.09
|
|
Kenh Dong Water
|
35,220.71
|
35,876.37
|
36,026.25
|
|
Thu Duc Water
|
134,567.02
|
133,457.99
|
136,774.84
|
|
MWO
|
507,690.79
|
576,516.27
|
556,048.52
|
|
East Zone
|
507,690.79
|
576,516.27
|
556,048.52
|
|
MWPV
|
250,456.86
|
307,407.77
|
320,442.03
|
|
Boracay Water
|
19,431.84
|
13,515.53
|
10,058.98
|
|
Bulacan Aqua
|
4,303.41
|
4,735.74
|
5,409.56
|
|
Bulakan Water
|
59.76
|
5,275.83
|
5,466.09
|
|
Calasiao Water
|
777.96
|
2,376.35
|
1,201.70
|
|
Calbayog Water
|
-
|
7,591.81
|
8,275.24
|
|
Cebu Water
|
19,021.45
|
19,176.20
|
28,053.60
|
|
Clark Water
|
56,715.06
|
56,385.90
|
49,958.91
|
|
Estate Water
|
60,620.92
|
74,580.30
|
74,631.46
|
|
Laguna Water
|
88,476.38
|
94,293.62
|
98,907.37
|
|
Obando Water
|
1,050.09
|
1,078.35
|
677.13
|
|
South Luzon Water
|
-
|
21,210.99
|
23,044.04
|
|
Tagum Water
|
-
|
7,187.15
|
14,757.97
|
|
MWTS
|
1,756.88
|
770.24
|
-
|
|
Healthy Family
|
1,756.88
|
770.24
|
-
|
|
Total
|
929,692.27
|
1,053,662.15
|
1,049,291.64
|
Note: Energy includes electricity, diesel and gasoline consumption
Conversion factors: Electricity: 1kwh = 0.0036 GJ; 1L Diesel = 0.0387 GJ; 1
Liter Gasoline = 0.0348 GJ
Energy Intensity of Water Supply Facilities, GJ/MCM billed volume
GRI 302-3
|
Business Unit
|
2019
|
2020
|
2021
|
|
MWAP
|
986
|
974
|
972
|
|
Kenh Dong Water
|
570
|
553
|
531
|
|
Thu Duc Water
|
1,218
|
1,226
|
1,246
|
|
MWO
|
785
|
994
|
967
|
|
East Zone
|
785
|
994
|
967
|
|
MWPV
|
1,959
|
2,350
|
2,435
|
|
Boracay Water
|
2,198
|
2,352
|
2,023
|
|
Bulacan Aqua
|
2,279
|
2,157
|
2,336
|
|
Bulakan Water
|
24
|
1,850
|
1,907
|
|
Calasiao Water
|
1,946
|
4,609
|
2,083
|
|
Calbayog Water
|
-
|
2,556
|
2,854
|
|
Cebu Water
|
1,467
|
1,697
|
2,620
|
|
Clark Water
|
3,526
|
3,559
|
3,415
|
|
Estate Water
|
1,653
|
2,604
|
2,727
|
|
Laguna Water
|
1,838
|
1,942
|
2,005
|
|
Obando Water
|
554
|
528
|
318
|
|
South Luzon Water
|
n/a
|
4,332
|
4,431
|
|
Tagum Water
|
n/a
|
1,943
|
1,826
|
|
Total
|
987
|
1,180
|
1,184
|
Energy Intensity of Wastewater Facilities, GJ/MCM treated
wastewater
GRI 302-3
|
Business Unit
|
2019
|
2020
|
2021
|
|
MWO
|
1,415
|
1,061
|
1,308
|
|
East Zone
|
1,415
|
1,061
|
1,308
|
|
MWPV
|
2,237
|
2,267
|
1,926
|
|
Boracay Water
|
4,346
|
4,845
|
4,180
|
|
Clark Water
|
633
|
1,038
|
687
|
|
Estate Water
|
3,290
|
3,050
|
2,740
|
|
Laguna Water
|
1,543
|
1,951
|
1,758
|
|
Total
|
1,663
|
1,353
|
1,463
|
Greenhouse Gas Emissions
Scope 1 Emission (Direct), tons CO2 (eq)
GRI 305-1
|
Business Unit
|
2019
|
2020
|
2021
|
|
MWAP
|
0.24
|
54.34
|
44.40
|
|
Kenh Dong Water
|
-
|
4.96
|
4.96
|
|
Thu Duc Water
|
0.24
|
49.38
|
39.44
|
|
MWO
|
2,823.69
|
3,079.86
|
3,425.38
|
|
East Zone
|
2,823.69
|
3,079.86
|
3,425.38
|
|
MWPV
|
2,088.75
|
2,284.24
|
2,958.54
|
|
Boracay Water
|
385.47
|
290.46
|
137.70
|
|
Bulacan Aqua
|
4.30
|
13.83
|
15.37
|
|
Bulakan Water
|
3.99
|
15.41
|
42.31
|
|
Calasiao Water
|
18.62
|
119.34
|
33.18
|
|
Calbayog Water
|
-
|
111.96
|
230.71
|
|
Cebu Water
|
48.62
|
28.31
|
185.78
|
|
Clark Water
|
417.69
|
186.83
|
181.81
|
|
Estate Water
|
924.27
|
1,199.43
|
1,589.72
|
|
Laguna Water
|
283.06
|
271.41
|
267.54
|
|
Obando Water
|
2.73
|
5.14
|
5.64
|
|
South Luzon Water
|
-
|
-
|
147.80
|
|
Tagum Water
|
-
|
42.12
|
121.00
|
|
MWTS
|
248.51
|
51.83
|
-
|
|
Healthy Family
|
248.51
|
51.83
|
-
|
|
Total
|
4,913
|
5,418
|
6,428
|
Scope 2 emission (Indirect), tons CO2 (eq)
GRI 305-2
|
Business Unit
|
2019
|
2020
|
2021
|
|
MWAP
|
40,790.67
|
41,028.33
|
41,057.22
|
|
MWO
|
92,724.72
|
103,716.37
|
93,558.33
|
|
East Zone
|
92,724.72
|
103,716.37
|
93,558.33
|
|
MWPV
|
41,896.19
|
52,338.39
|
52,551.47
|
|
Boracay Water
|
2,641.18
|
1,763.25
|
1,527.30
|
|
Bulacan Aqua
|
804.93
|
861.41
|
984.81
|
|
Bulakan Water
|
-
|
958.43
|
920.90
|
|
Calasiao Water
|
96.07
|
126.77
|
137.65
|
|
Calbayog Water
|
-
|
1,136.36
|
943.51
|
|
Cebu Water
|
3,479.52
|
3,564.01
|
4,169.25
|
|
Clark Water
|
9,632.28
|
10,179.42
|
8,979.57
|
|
Estate Water
|
8,998.57
|
10,895.52
|
9,853.47
|
|
Laguna Water
|
16,051.86
|
17,197.34
|
18,108.58
|
|
Obando Water
|
191.78
|
190.67
|
112.88
|
|
South Luzon Water
|
-
|
4,027.73
|
3,969.68
|
|
Tagum Water
|
-
|
1,437.50
|
2,843.87
|
|
MWTS
|
333.61
|
146.26
|
-
|
|
Healthy Family
|
333.61
|
146.26
|
-
|
|
Total
|
175,745
|
197,229
|
187,167
|
Scope 3 GHG emission - desludging by contractors, tons CO2 (eq)
GRI 305-3
|
Business Unit
|
2019
|
2020
|
2021
|
|
MWO
|
1,518.23
|
1,003.44
|
1,477.83
|
|
East Zone
|
1,518.23
|
1,003.44
|
1,477.83
|
|
MWPV
|
35.44
|
36.43
|
44.14
|
|
Boracay Water
|
-
|
-
|
-
|
|
Clark Water
|
-
|
-
|
-
|
|
Estate Water
|
-
|
-
|
-
|
|
Laguna Water
|
35.44
|
36.43
|
44.14
|
|
Total
|
1,554
|
1,040
|
1,522
|
GHG Intensity of Water Facilities, tons CO2 (eq)/MCM billed volume
GRI 305-4
|
Business Unit
|
2019
|
2020
|
2021
|
|
MWAP
|
236.80
|
236.69
|
231.57
|
|
Kenh Dong Water
|
136.95
|
132.56
|
129.46
|
|
Thu Duc Water
|
292.65
|
299.00
|
294.88
|
|
MWO
|
146.66
|
184.05
|
165.34
|
|
East Zone
|
146.66
|
184.05
|
165.34
|
|
MWPV
|
346.32
|
421.02
|
424.96
|
|
Boracay Water
|
345.09
|
385.01
|
358.23
|
|
Bulacan Aqua
|
432.70
|
408.52
|
442.79
|
|
Bulakan Water
|
1.58
|
344.63
|
340.76
|
|
Calasiao Water
|
247.45
|
467.85
|
290.68
|
|
Calbayog Water
|
-
|
420.29
|
405.02
|
|
Cebu Water
|
272.15
|
317.96
|
406.66
|
|
Clark Water
|
634.80
|
660.77
|
635.57
|
|
Estate Water
|
237.77
|
395.53
|
394.81
|
|
Laguna Water
|
346.87
|
366.04
|
378.27
|
|
Obando Water
|
102.36
|
95.55
|
55.26
|
|
South Luzon Water
|
n/a
|
822.52
|
791.22
|
|
Tagum Water
|
n/a
|
399.96
|
366.90
|
|
Total
|
193.55
|
228.91
|
218.52
|
GHG Intensity of Wastewater Facilities, tons CO2 (eq)/MCM treated
wastewater
GRI 305-4
|
Business Unit
|
2019
|
2020
|
2021
|
|
MWO
|
297.50
|
212.27
|
275.52
|
|
East Zone
|
297.50
|
212.27
|
275.52
|
|
MWPV
|
403.07
|
405.39
|
348.08
|
|
Boracay Water
|
677.23
|
669.93
|
658.51
|
|
Clark Water
|
102.03
|
190.99
|
123.62
|
|
Estate Water
|
620.93
|
560.62
|
501.58
|
|
Laguna Water
|
307.96
|
387.58
|
354.44
|
|
Total
|
329.30
|
259.06
|
293.75
|
Hazardous Wastes Generated, tons
|
Business Unit
|
2019
|
2020
|
2021
|
|
Busted fluorescent lamps (BFL-D407) generated
|
0.57
|
0.29
|
0.31
|
|
Containers previously containing hazardous and toxic materials
(J201) generated
|
1.77
|
0.26
|
0.61
|
|
Used lead acid batteries (ULAB-D406) generated
|
3.04
|
3.56
|
1.69
|
|
Used oil (I101 to I104) generated
|
13.30
|
4.95
|
19.91
|
|
Waste electrical and electronic equipment (WEEE-M506) generated
|
-
|
-
|
0.39
|
|
COD Vials (D407) generated
|
0.23
|
0.53
|
0.69
|
|
Spent Chemicals (D405/G704) generated
|
0.13
|
1.41
|
2.25
|
|
Pathological or Infectious wastes (M501) generated
|
-
|
0.29
|
-
|
|
Other unspecified hazardous waste generated
|
8.31
|
122.64
|
37.33
|
|
Total
|
27.33
|
133.94
|
63.18
|
Hazardous Wastes Disposed, tons
|
Business Unit
|
2019
|
2020
|
2021
|
|
Busted fluorescent lamps (BFL-D407) disposed
|
0.48
|
0.03
|
0.04
|
|
Containers previously containing hazardous and toxic materials
(J201) disposed
|
0.11
|
0.02
|
0.19
|
|
Used lead acid batteries (ULAB-D406) disposed
|
4.79
|
1.39
|
-
|
|
Used oil (I101 to I104) disposed
|
7.29
|
46.18
|
6.22
|
|
Waste electrical and electronic equipment (WEEE-M506) disposed
|
-
|
-
|
0.10
|
|
COD Vials (D407) disposed
|
0.68
|
0.15
|
0.01
|
|
Spent Chemicals (D405/G704) disposed
|
0.11
|
0.50
|
1.56
|
|
Pathological or Infectious wastes (M501) disposed
|
-
|
-
|
0.03
|
|
Other unspecified hazardous waste disposed
|
34.58
|
130.17
|
12.65
|
|
Total
|
48.03
|
178.45
|
20.81
|
Watershed Profile and Projects
|
General Nakar (Kaliwa, Kanan, Umiray, and 13 other minor
watersheds)
Protected Area designated as Forest Reserve
|
|
Project Partners
|
-
General Nakar Sustainable Integrated Area Development (SIAD)
Project Management Office under the General Nakar LGU
- MWSS, MWCI, MWSI
|
|
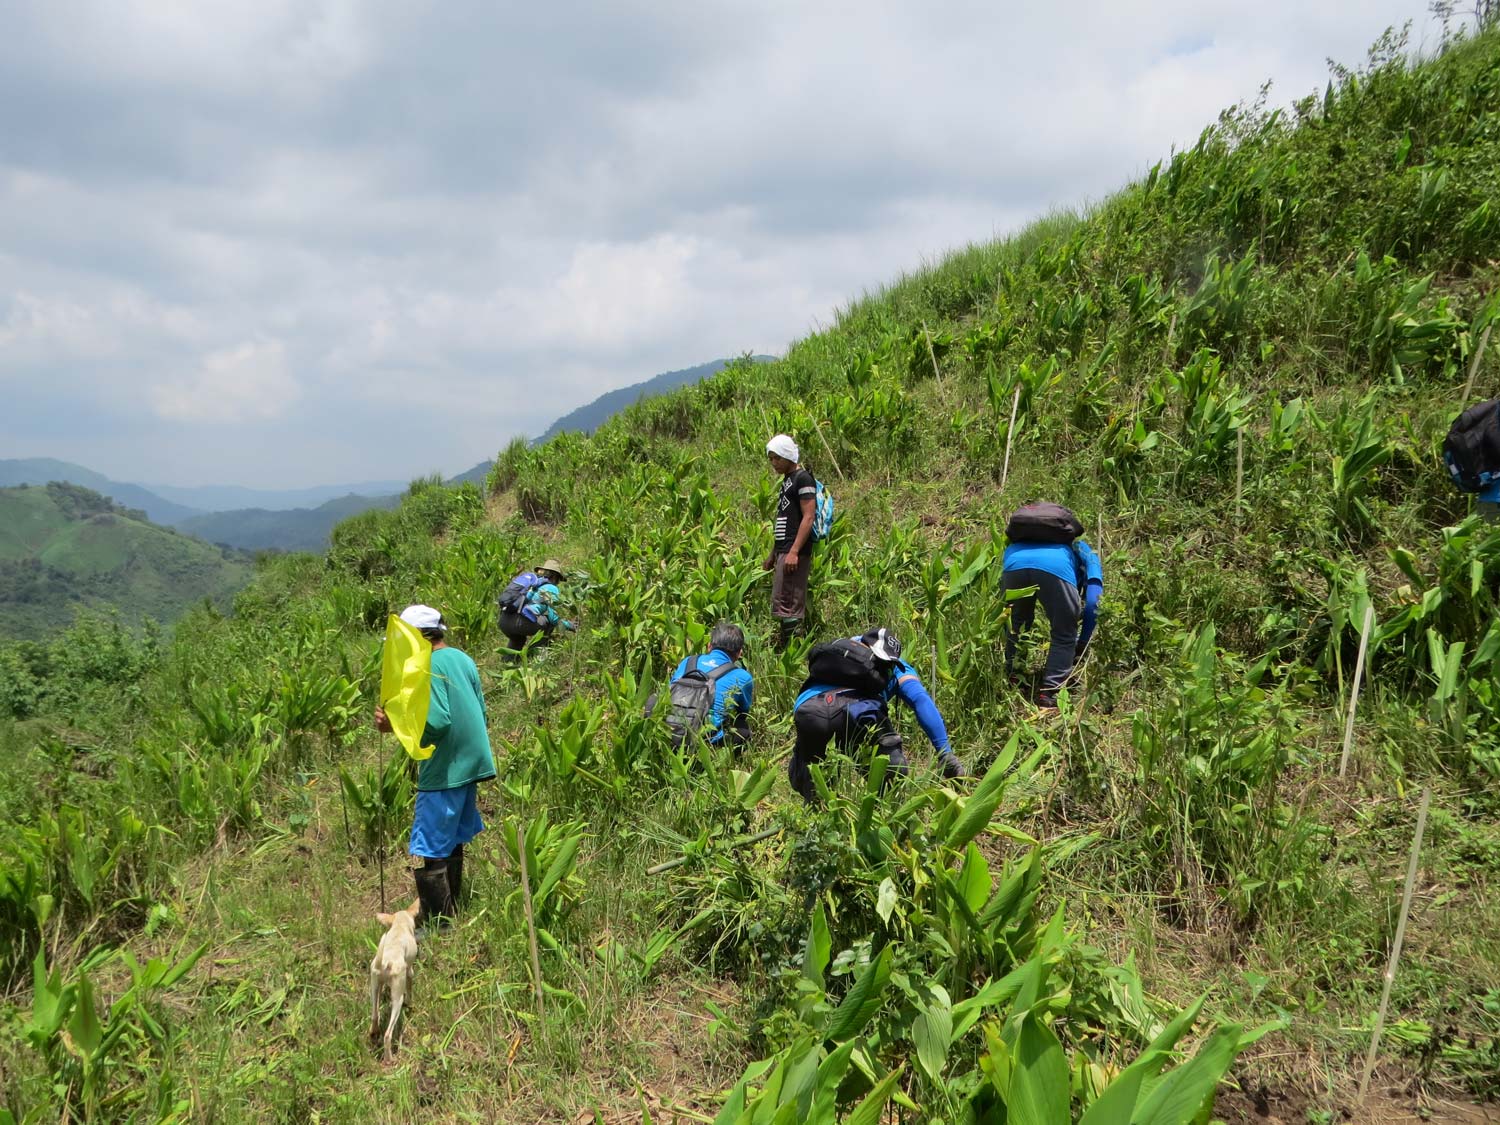
Projects in 2021
|
-
Reforestation in 32.5 ha with 20,313 native trees by Manila Water
-
Forest and water-based patrolling, confiscation and hauling of
illegally logged lumber and forest products were undertaken
-
Ongoing operation of the 8 DOLE-registered enterprise
organizations in 2020 and provided them with seed money for the
operation of their chosen enterprise which aims to divert the
dependencies of the communities from the watershed and deter
forest degradation. Monthly monitoring is undertaken to assess the
operation of each organization
-
Registered additional nine IPs and non-IPs enterprise
organizations with DOLE and provided them with seed money for
their proposed enterprise
-
Assisted 2 barangays on spring development for water supply of the
community
-
Finalization of Climate Responsive Integrated Watershed Management
Plans for Kaliwa, Kanan and Umiray Watersheds (on-going review by
the Sangguniang Bayan of General Nakar, Quezon prior to
endorsement to DENR for approval)
|
|
2022 – 2025 Action Plans
|
-
Continuation of the SIAD Project (until 2027), which includes 2
components:
- Forest protection
- Reforestation of 96 hectares with 60,000 native trees
- Enterprise development
- Assistance on water access, sanitation and hygiene (WASH)
- IEC and capacity building
-
Implementation of the Climate Responsive Integrated Watershed
Management Plans for Kaliwa, Kanan and Umiray Watersheds
|
|
Ipo Watershed
Protected Area designated as Forest Reserve
|
|
Project Partners
|
-
Department of Environment and Natural Resources Region 3,
Provincial Environment and Natural Resources Office Bulacan and
Community Environment and Natural Resources Office Guiguinto,
Bulacan
- MWSS, MWCI, MWSI,
- Bantay Gubat
- MWF, WWF
|
|
Projects in 2021
|
- Funding of the forest protection through Bantay Gubat
-
Development of Terms of Reference (TOR) and Tripartite Executive
Committee Resolution with the Ipo Watershed Project Management
Team (PMT) composed of MWSS, Manila Water, Maynilad and CPF for
the Engagement of Service Provider for the Management of Bantay
Gubat and Strengthening of the Ipo Wateshed Protection System
(Bantay Ipo Project)
-
Development of TOR for the Consultancy Services for the
Formulation of 25-year Integrated Watershed Management Plan and
Institution Building for Ipo Watershed
-
Development of WASH Program for the Dumagat and Ipo watershed
community through Manila Water Foundation (MWF)
-
Conducted Technical and Social Assessment by MWF with MWSS and WWF
-
Prepared preliminary design for water supply to be presented to
MWSS prior to implementation
|
|
2022 – 2025 Action Plans
|
-
Engagement of Service Provider for the Management of Bantay Gubat
and Strengthening of the Ipo Watershed Protection System; for fund
sharing with Maynilad
-
Formulation of 25-year IWMP and Institution Building for Ipo
Watershed; for fund sharing wth Maynilad
-
Implementation of the WASH Program for Dumagat and Ipo community
-
Tree Planting in 300 ha with 187,500 native trees from 2023 to
2025
- Forest Carbon Accounting Project
|
|
Alat Watershed
|
|
Projects in 2021
|
-
Conceptually approved and ongoing business case processing of La
Mesa Watershed Reservation and Tributaries: Terrestrial and
Aquatic Ecosystem Study, Vulnerability Assessment, and Integrated
Watershed Management Plan for Alat Watershed
|
|
2022 – 2025 Action Plans
|
-
Formulation of Integrated Watershed Management Plan for Alat
Watershed
|
|
La Mesa Watershed
Protected Area designated as a Watershed reservation
|
|
Project Partners
|
La Mesa Watershed Reservation Multi-sectoral Management Council
composed of
DENR, MWSS, MWC, MWSI, Quezon City LGU and ABS-CBN Lingkod Kapamilya
Foundation, Inc. - Bantay Kalikasan (ALKFI-BK)
|
|
Projects in 2021
|
- Protection of 2,659 ha through ALKFI-BK
- Enrichment of 100 ha with 40,000 native trees
-
Maintenance and development of area enriched from 2018 to 2020
covering 472 ha
-
Conceptually approved and on-going business case processing of La
Mesa Watershed Reservation and Tributaries: Terrestrial and
Aquatic Ecosystem Study, Vulnerability Assessment, and Integrated
Watershed Management Plan for Alat Watershed
|
|
2022 – 2025 Action Plans
|
-
La Mesa Watershed Reservation Terrestrial and Aquatic Ecosystem
Study and Vulnerability Assessment (Phase 1)
- Enrichment of 697.5 ha equivalent to 279,000 native trees
-
Maintenance and development of previously enriched areas for a
period of 3 years
- Forest protection
- Forest Carbon Accounting Project
- Fish Inventory and Characterization;
- Harvesting of janitor fish and other invasive species
|
|
Upper Marikina Watershed
Protected Area designated as Protected landscape
|
|
Project Partners
|
-
Department of Environment and Natural Resources Region 4A and
Provincial Environment and Natural Resources Office Rizal
- National Commission on Indigenous Peoples
-
Peoples Organization/Indigenous Peoples Organizations (KABALIKAT,
SJFFAI, PINGRUMAC, MASAKA, TUPAI, SANTRIBU, SJPBARA, AUFAI, TSKC,
SAUFA, SPCI, KAKSAAN)
- Local communities
- MWSS, MWCI
- LGUs of Antipolo, Baras, Rodriguez, San Mateo and Tanay
|
|
Projects in 2021
|
-
Preparation of Tripartite MOA with DENR Region 4A and Tulungan sa
Kabuhayan ng Calawis, Inc. (TSKC; People’s Organization for
the enrichment and maintenance of 135 ha in Mt. Dumiri, Calawis,
Antipolo City under the Adopt-a-graduated-NGP
-
Preparation of TOR for the 3-year Integrated Watershed
Rehabilitation, Management and Protection of Tayabasan
Sub-watershed
|
|
2022 – 2025 Action Plans
|
-
Enrichment and maintenance of 135 hectares in Mt. Dumiri, Calawis,
Antipolo City
-
Implementation of the 3-year Integrated Watershed Rehabilitation,
Management and Protection of Tayabasan Sub-watershed
- Forest Carbon Accounting Project
|
|
Laguna Lake
|
|
Project Partners
|
- Laguna Lake Development Authority
- Local Government Units
- Fisherfolks Organizations
|
|
Projects in 2021
|
-
Conceptually approved Feasibility Study on Laguna de Bay Shoreland
Rehabilitation and Management
|
|
2022 – 2025 Action Plans
|
-
Implementation of the Feasibility Study on Laguna de Bay Shoreland
Rehabilitation and Management; if found feasible, for project
implementation
-
Participation in the Laguna de Bay Region Water Quality Management
Area (WQMA) per concerned sub-watershed (SubWQMA)
-
13 SubWQMAs concerning the existing (Cardona TP in Central Bay)
and proposed (Pangil in East Bay and Hagonoy in West Bay) water
sources from specific portions of the Laguna de Bay
|
|
Nabaoy Watershed
|
|
Project Partners and Stakeholders
|
DENR, LGU, Nabaoy Forest Farmers Development Association,
communities
|
|
Projects in 2021
|
-
MOA with DENR and Nabaoy Forest Farmers Development
Association for the protection and rehabilitation of 40
hectares in Sitio Mananga
- Planted 885 native trees
|
|
2022 – 2025 Action Plans
|
- Maintenance of trees planted
- Completion of tree planting in the adopted 40 hectares
|
|
Luyang Watershed
|
|
Project Partner
|
CMWD Foundation, Inc.
|
|
Projects in 2021
|
Watershed characterization and Development of Integrated Watershed
Management Plan
|
|
2022 – 2025 Action Plans
|
Implementation of the Integrated Watershed Management Plan
|
|
Pan-as Hayiban Watershed
|
|
Project Partners
|
DENR, Calbayog Water District, LGU, communities
|
|
Projects in 2021
|
-
MOA with DENR and Calbayog Water District for the protection and
rehabilitation of 6.25 hectares with 3,125 native trees planted
- Planted 625 native trees in 1.25 hectares
|
|
2022 – 2025 Action Plans
|
- Maintenance of trees planted
- Completion of tree planting in the adopted 40 hectares
|
|
Villa Maria Watershed
|
|
Project Partners
|
DENR, Villa Maria Aeta Tribal Association
|
|
Projects in 2021
|
-
MOA with DENR to protect and rehabilitate 16 ha in 5 years (2020-
2025)
- Planting of 1,000 bamboo in 2.75 ha
|
|
2022 – 2025 Action Plans
|
Completion of bamboo nurturing in the adopted area
|


